How Has Spending For Intellectual and Developmental Disability (I/DD) Services and Supports Changed Over Time?
Total Fiscal Effort for Intellectual and Developmental Disabilities (I/DD) in the United States (Fiscal Years 1977-2023)
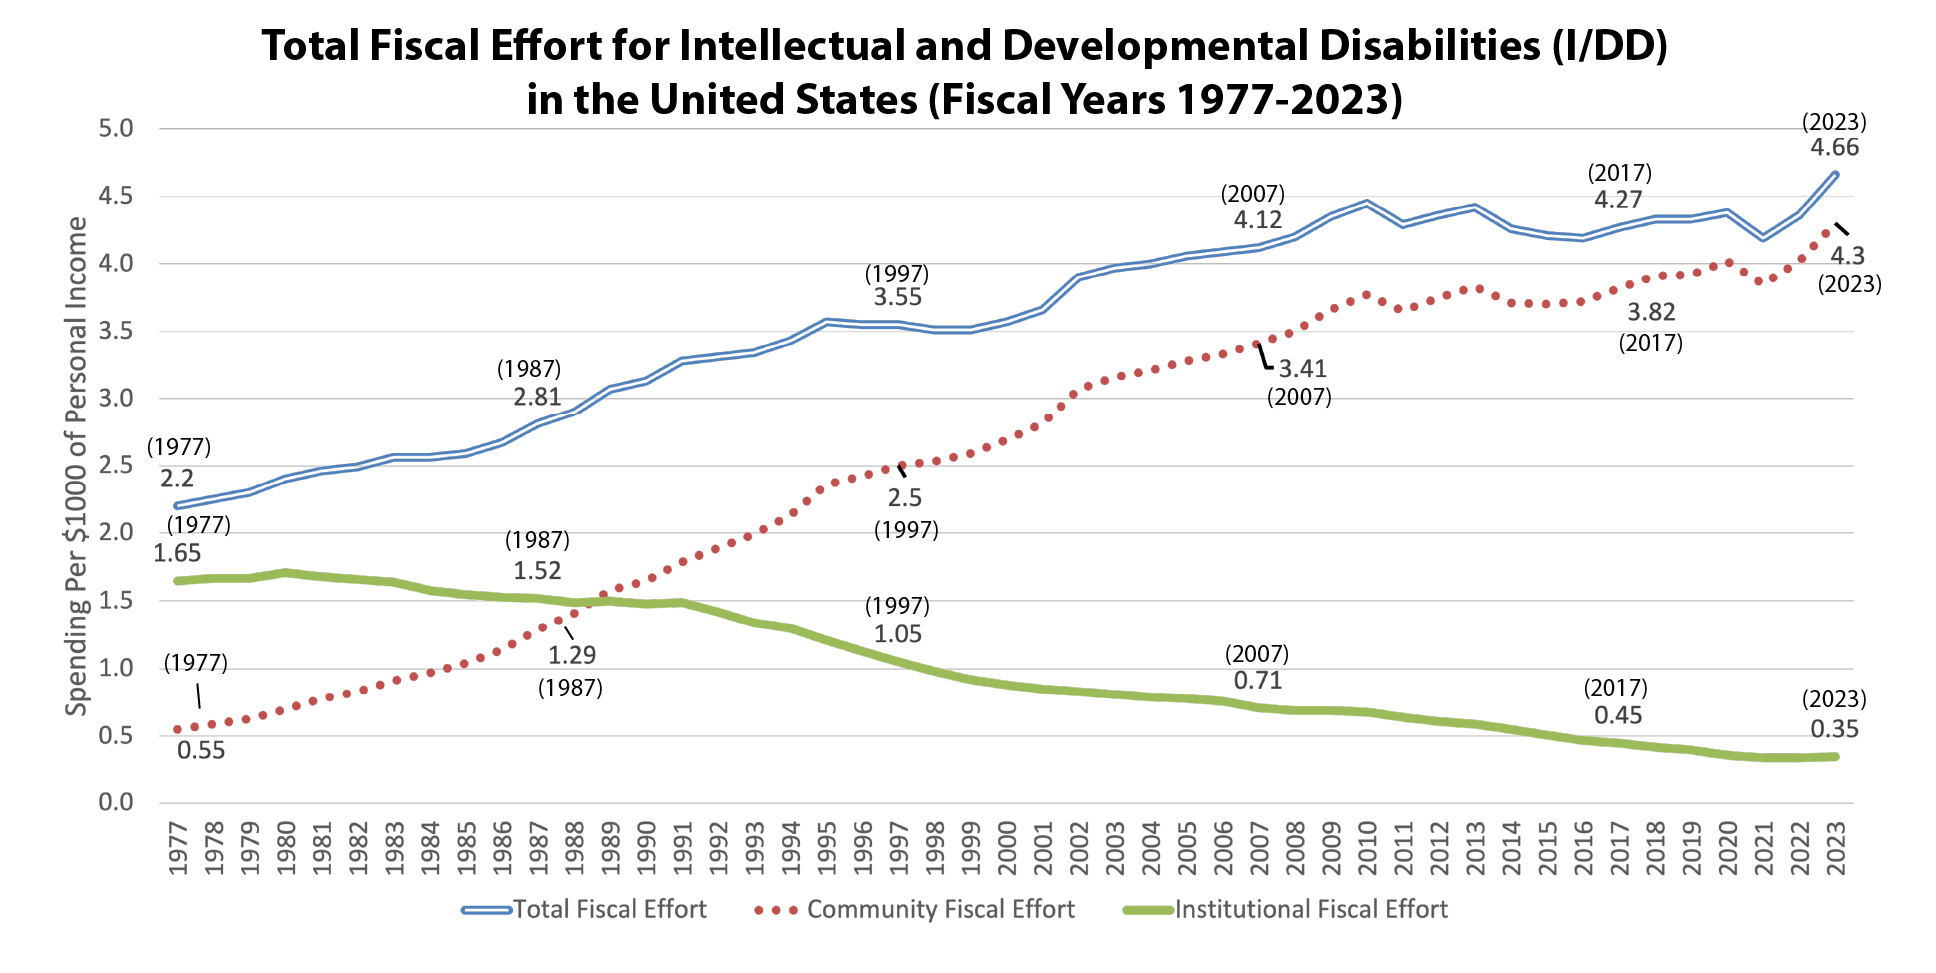
Chart Terms and Definitions
Fiscal effort is a measure of how much a state spends on intellectual and developmental disabilities, long-term supports and services per $1,000 of statewide personal income.
Community fiscal effort consists of federal, state, and local government spending for publicly or privately operated community-based residential programs serving 15 or fewer persons per setting.
Institutional fiscal effort consists of funding for residential facilities, which assume total care of the individual who is admitted. Institutions must be licensed and certified by the state, according to federal standards. These are Intermediate Care Facilities (ICFs). (Medicaid.gov)
For more definitions visit the Data Dictionary
State of the States Information
For more information about State of the States, contact stateofthestates@ku.edu
This project is funded through a cooperative agreement from the Administration on Community Living, U.S. Department of Health and Human Services, Cooperative Agreement #90DNPAPA0005. Grantees undertaking projects under government sponsorship are encouraged to express freely their findings and conclusions. Points of view or opinions do not therefore necessarily represent official ACL policy.
Suggested Citation
State of the States in Intellectual and Developmental Disabilities (year). [Page Name]. Lawrence: University of Kansas, State of the States, Kansas Center on Developmental Disabilities, Life Span Institute. Retrieved from: https://stateofthestates.ku.edu