How Much Do States Pay for Different Kinds of Services and Supports
Total Public Spending for Intellectual and Developmental Disability (I/DD) Supports and Services in the United States (Fiscal Year 2023)
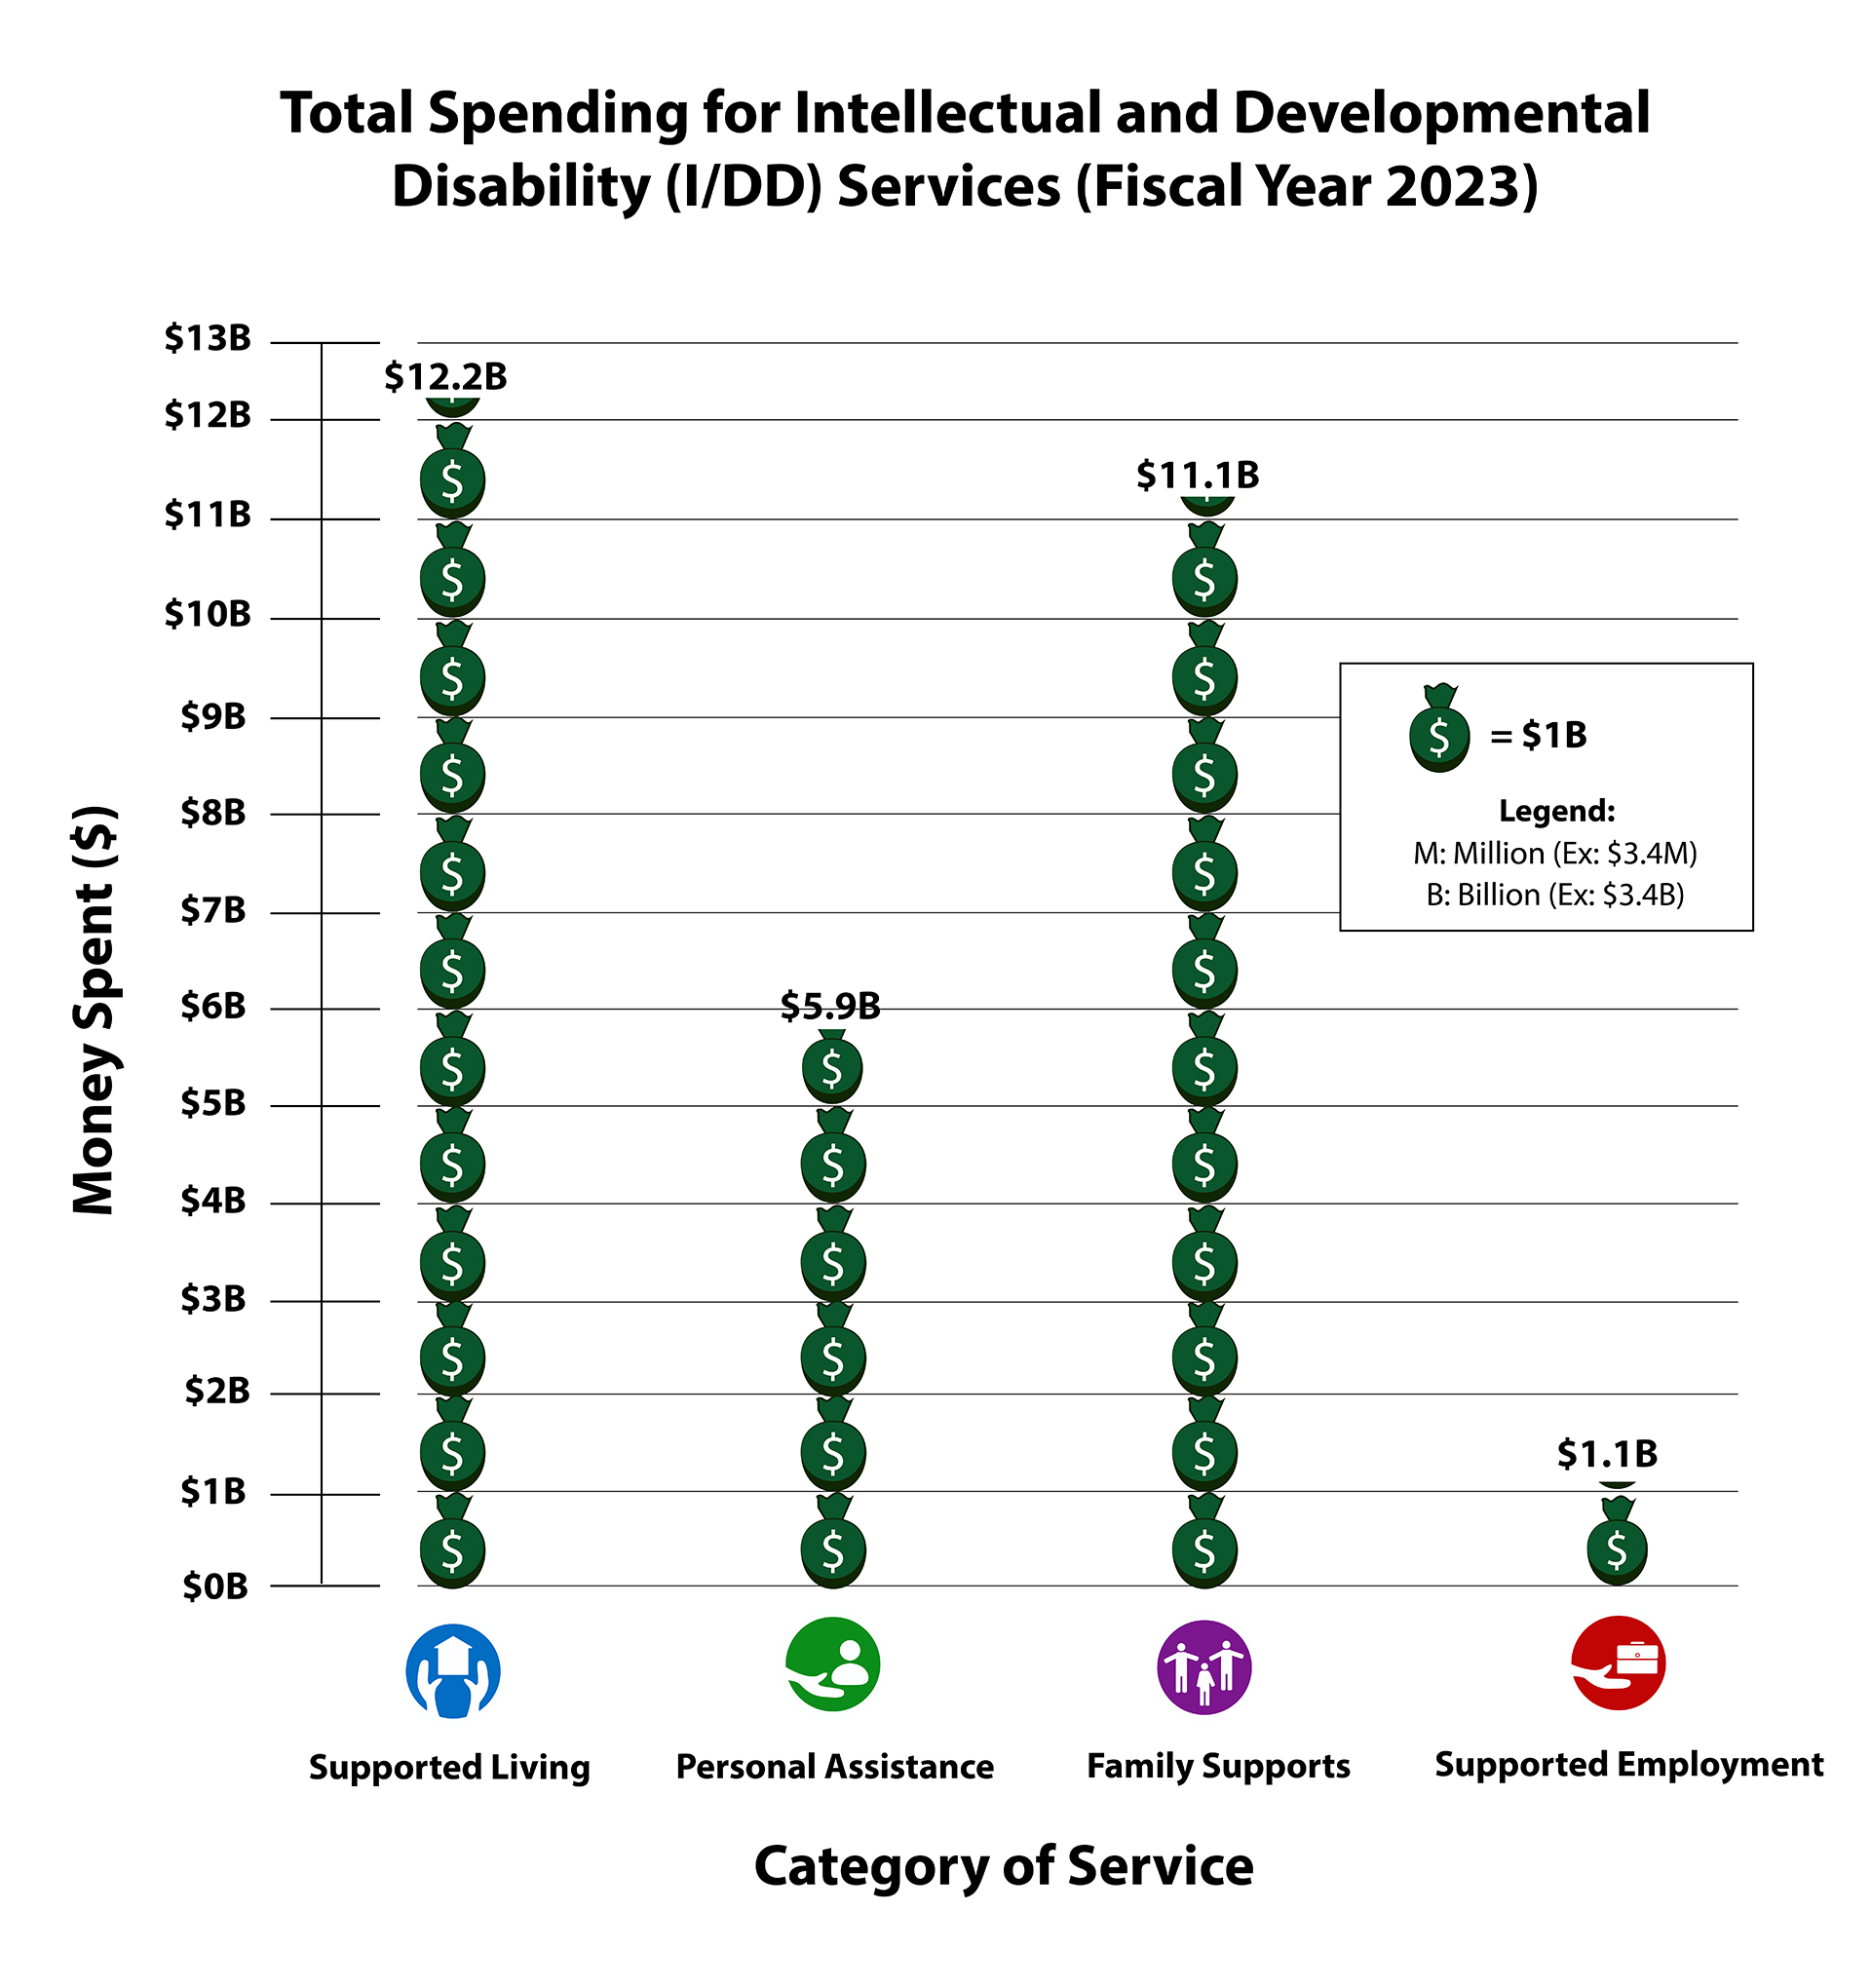
The graphics present a national picture of intellectual and developmental disabilities services and supports. Some states may vary in their definitions and reporting. Please visit our State Notes pages to learn more about reporting from our state agency partners. Below are the operational definitions used by the State of the States in Intellectual and Developmental Disabilities Project.
Chart Terms and Definitions
Supported Living - Supports funded by the state I/DD agency for adults in housing arrangements that guarantee: a)choice of where participants live and choice of house-mates; b) control of the living arrangement by the individual, the individual’s family or an organization not providing services to the individual with a disability; and c) supported living planning that recognizes the individual’s changing needs for effective support in their living arrangement and daily life.
Personal Assistance - Services that provide adults with I/DD the necessary level of support to remain in their homes. This includes guidance toward more independence and arrangements that exercise a measure of participant-direction.
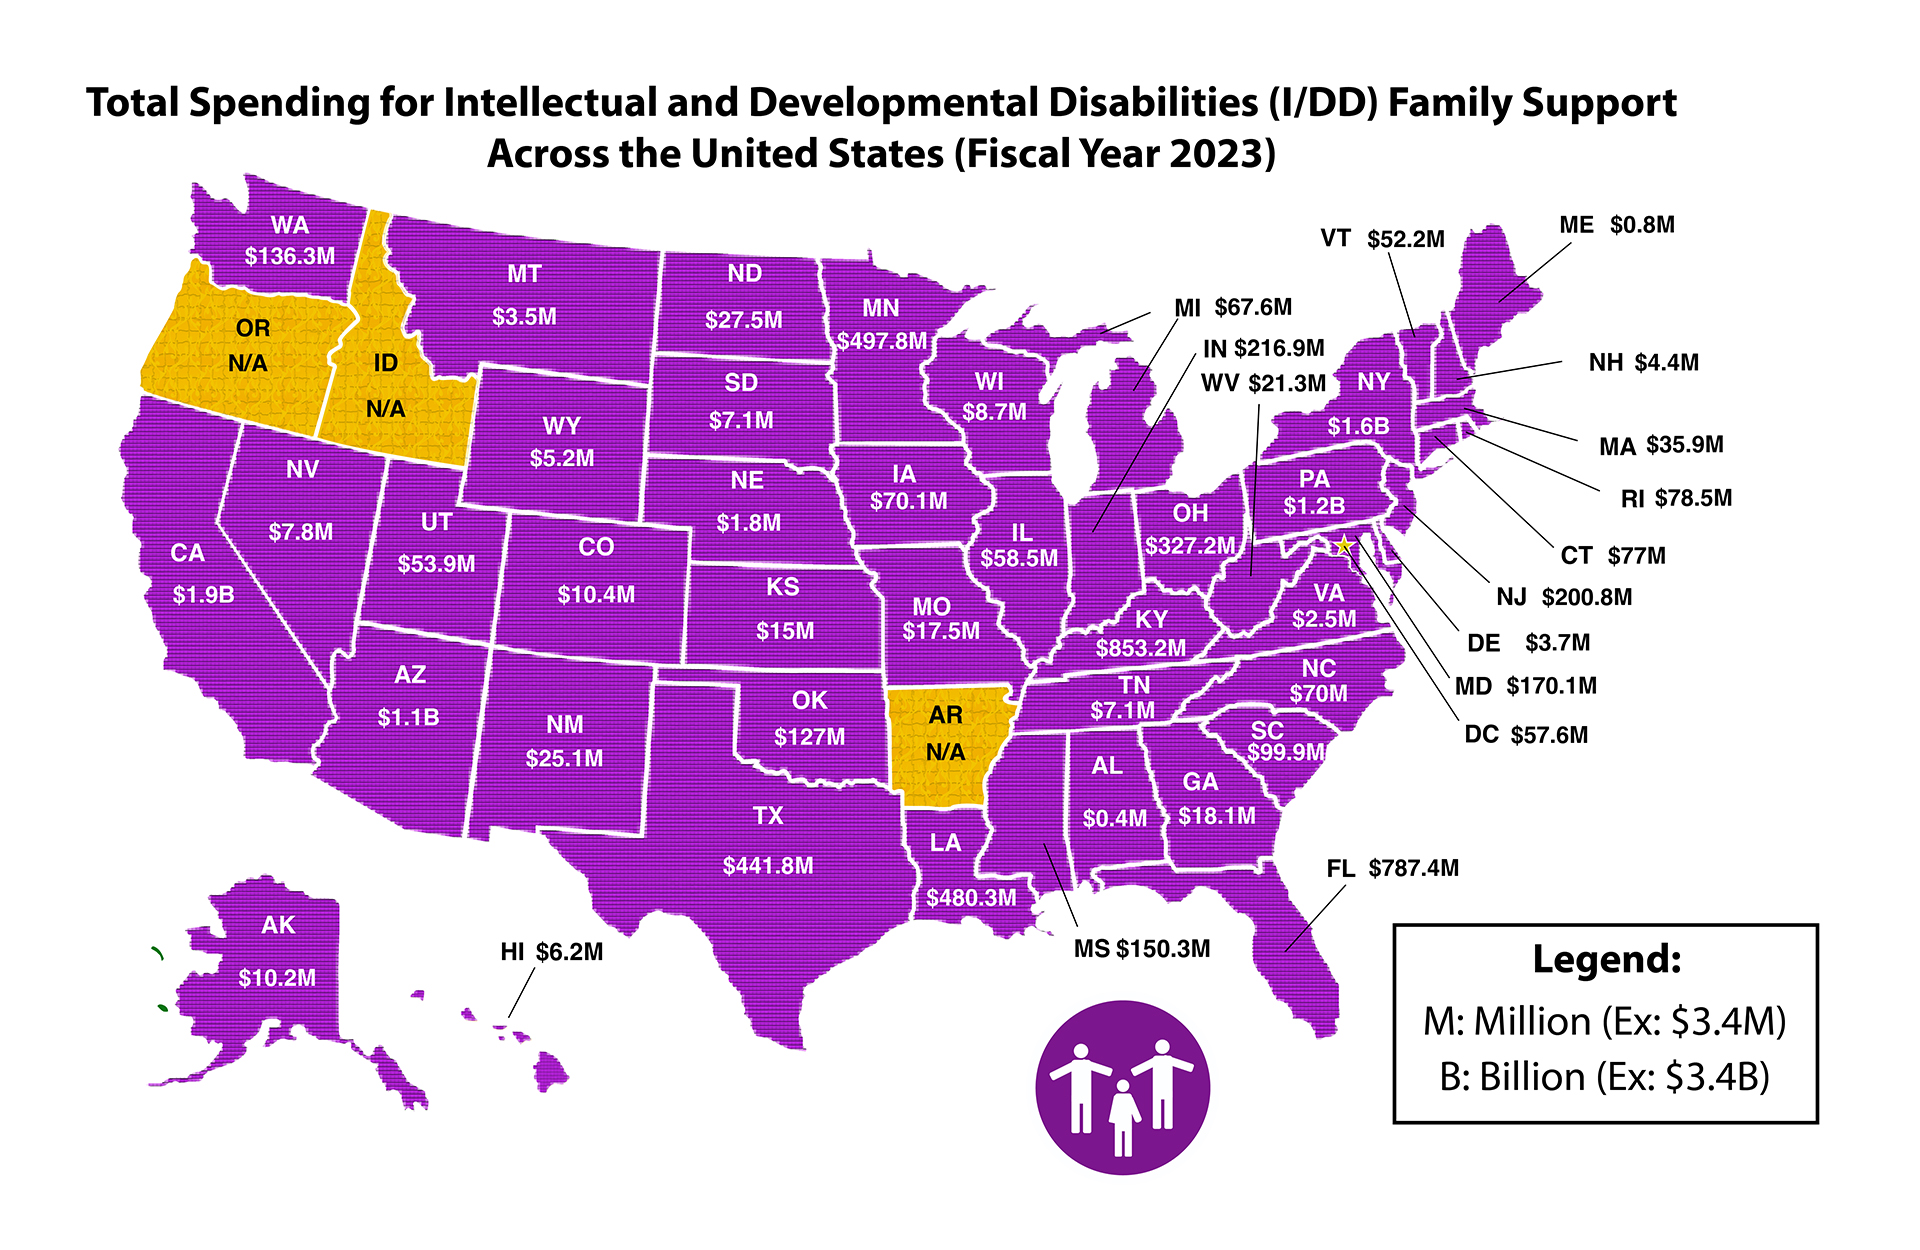
Family Supports - Community-based services provided to families of children or adults with ID/DD living in the family home with the family as the primary beneficiary. The state I/DD agency may provide vouchers, direct cash payments to families, reimbursement, or direct cash payments to serve providers. There are two categories of family support, 1) financial subsidy/cash payments to families; and 2) general family support payments including respite care, family counseling, equipment, architectural adaptation of the home, parent education and training, or other state designated categories of family support.
Supported Employment - Assistance in obtaining and keeping competitive employment, including customized employment in an integrated setting or employment in an integrated work setting in which an individual with a most significant disability is working on a short-term basis toward competitive integrated employment (Rehabilitation Act of 1973, as amended).
For more definitions visit the Data Dictionary
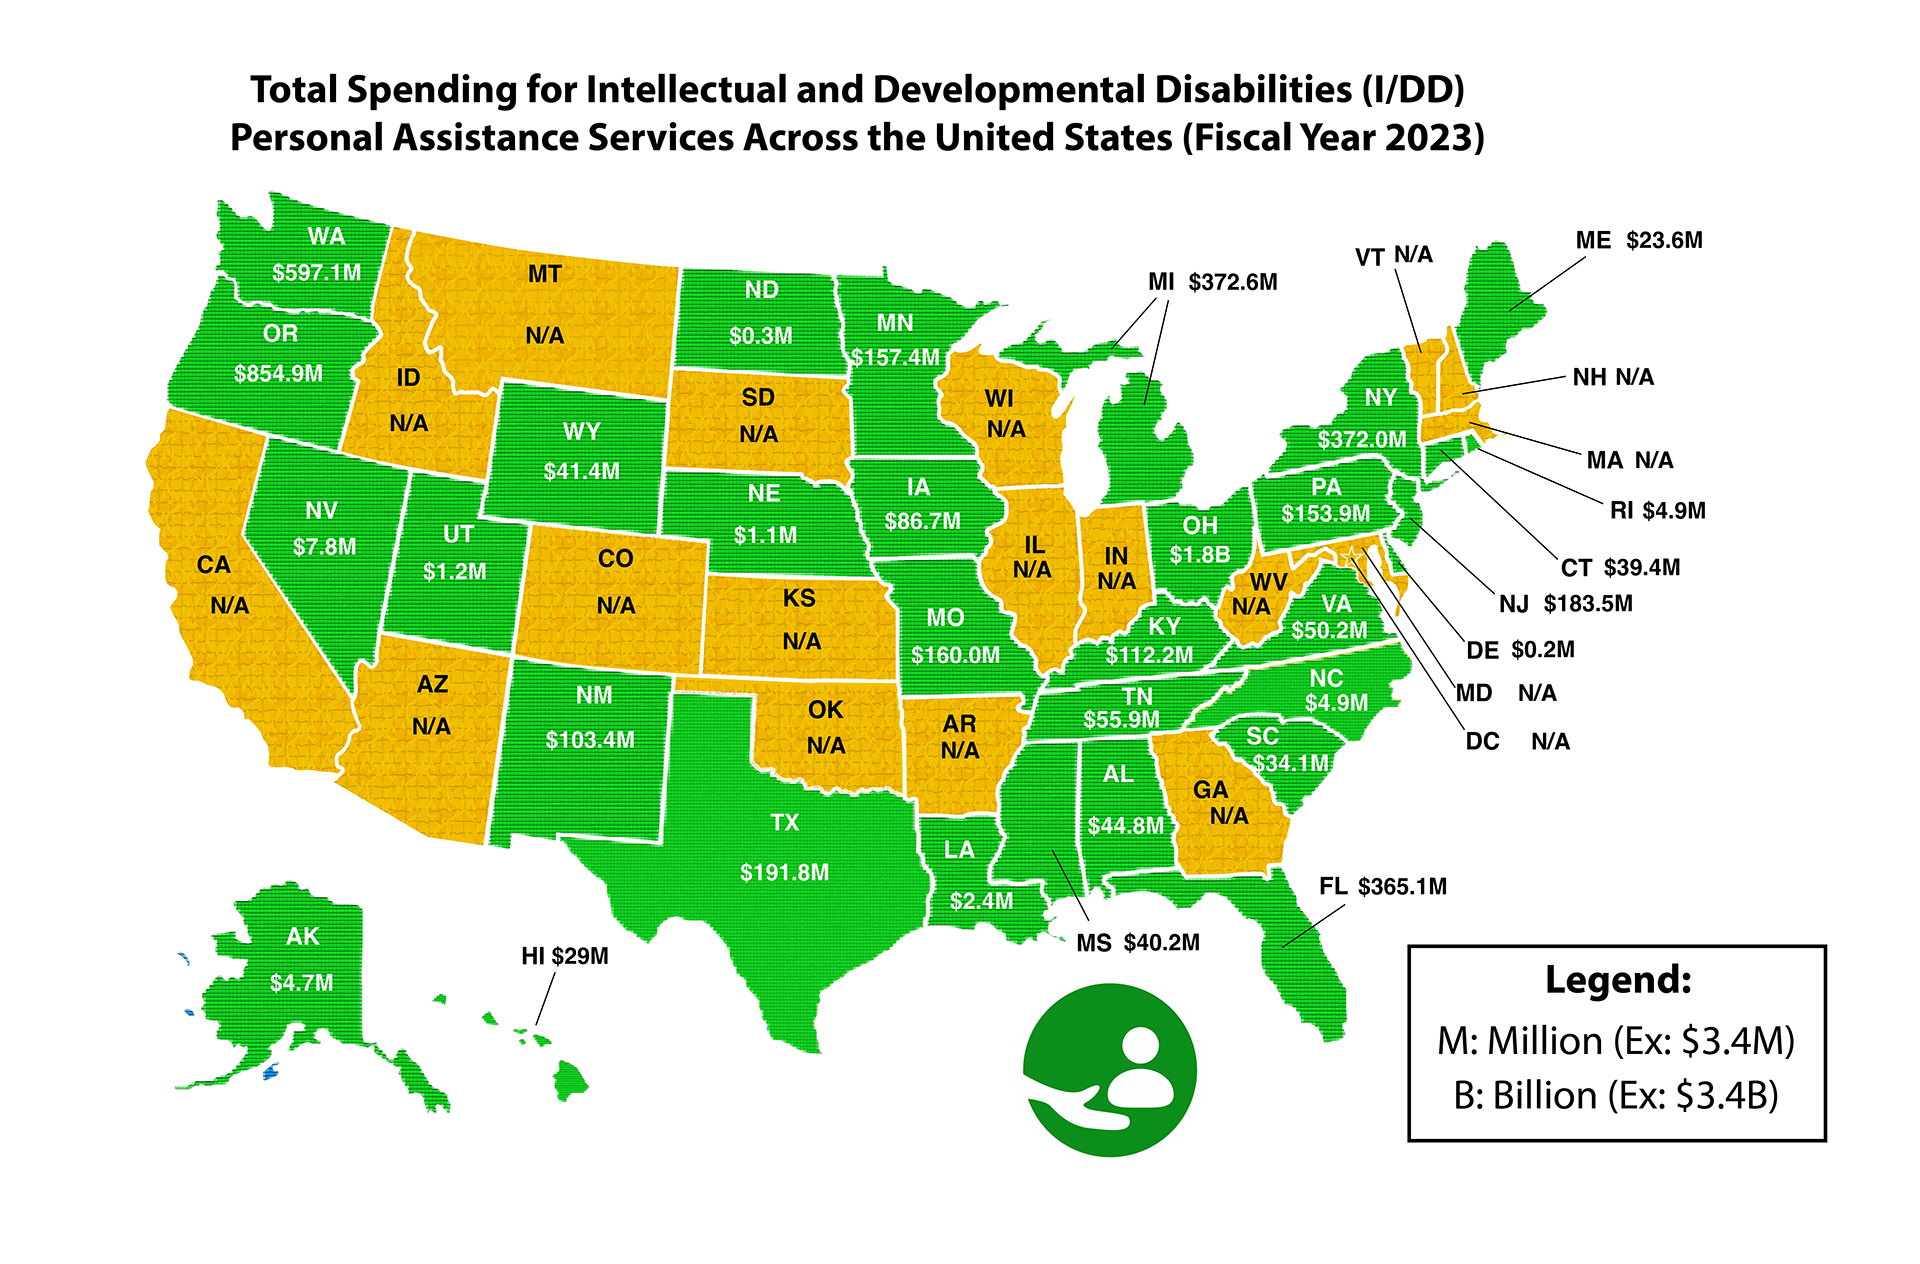
Total Spending for Intellectual and Developmental Disabilities (I/DD) Personal Assistance Services Across the United States (Fiscal Year 2023)
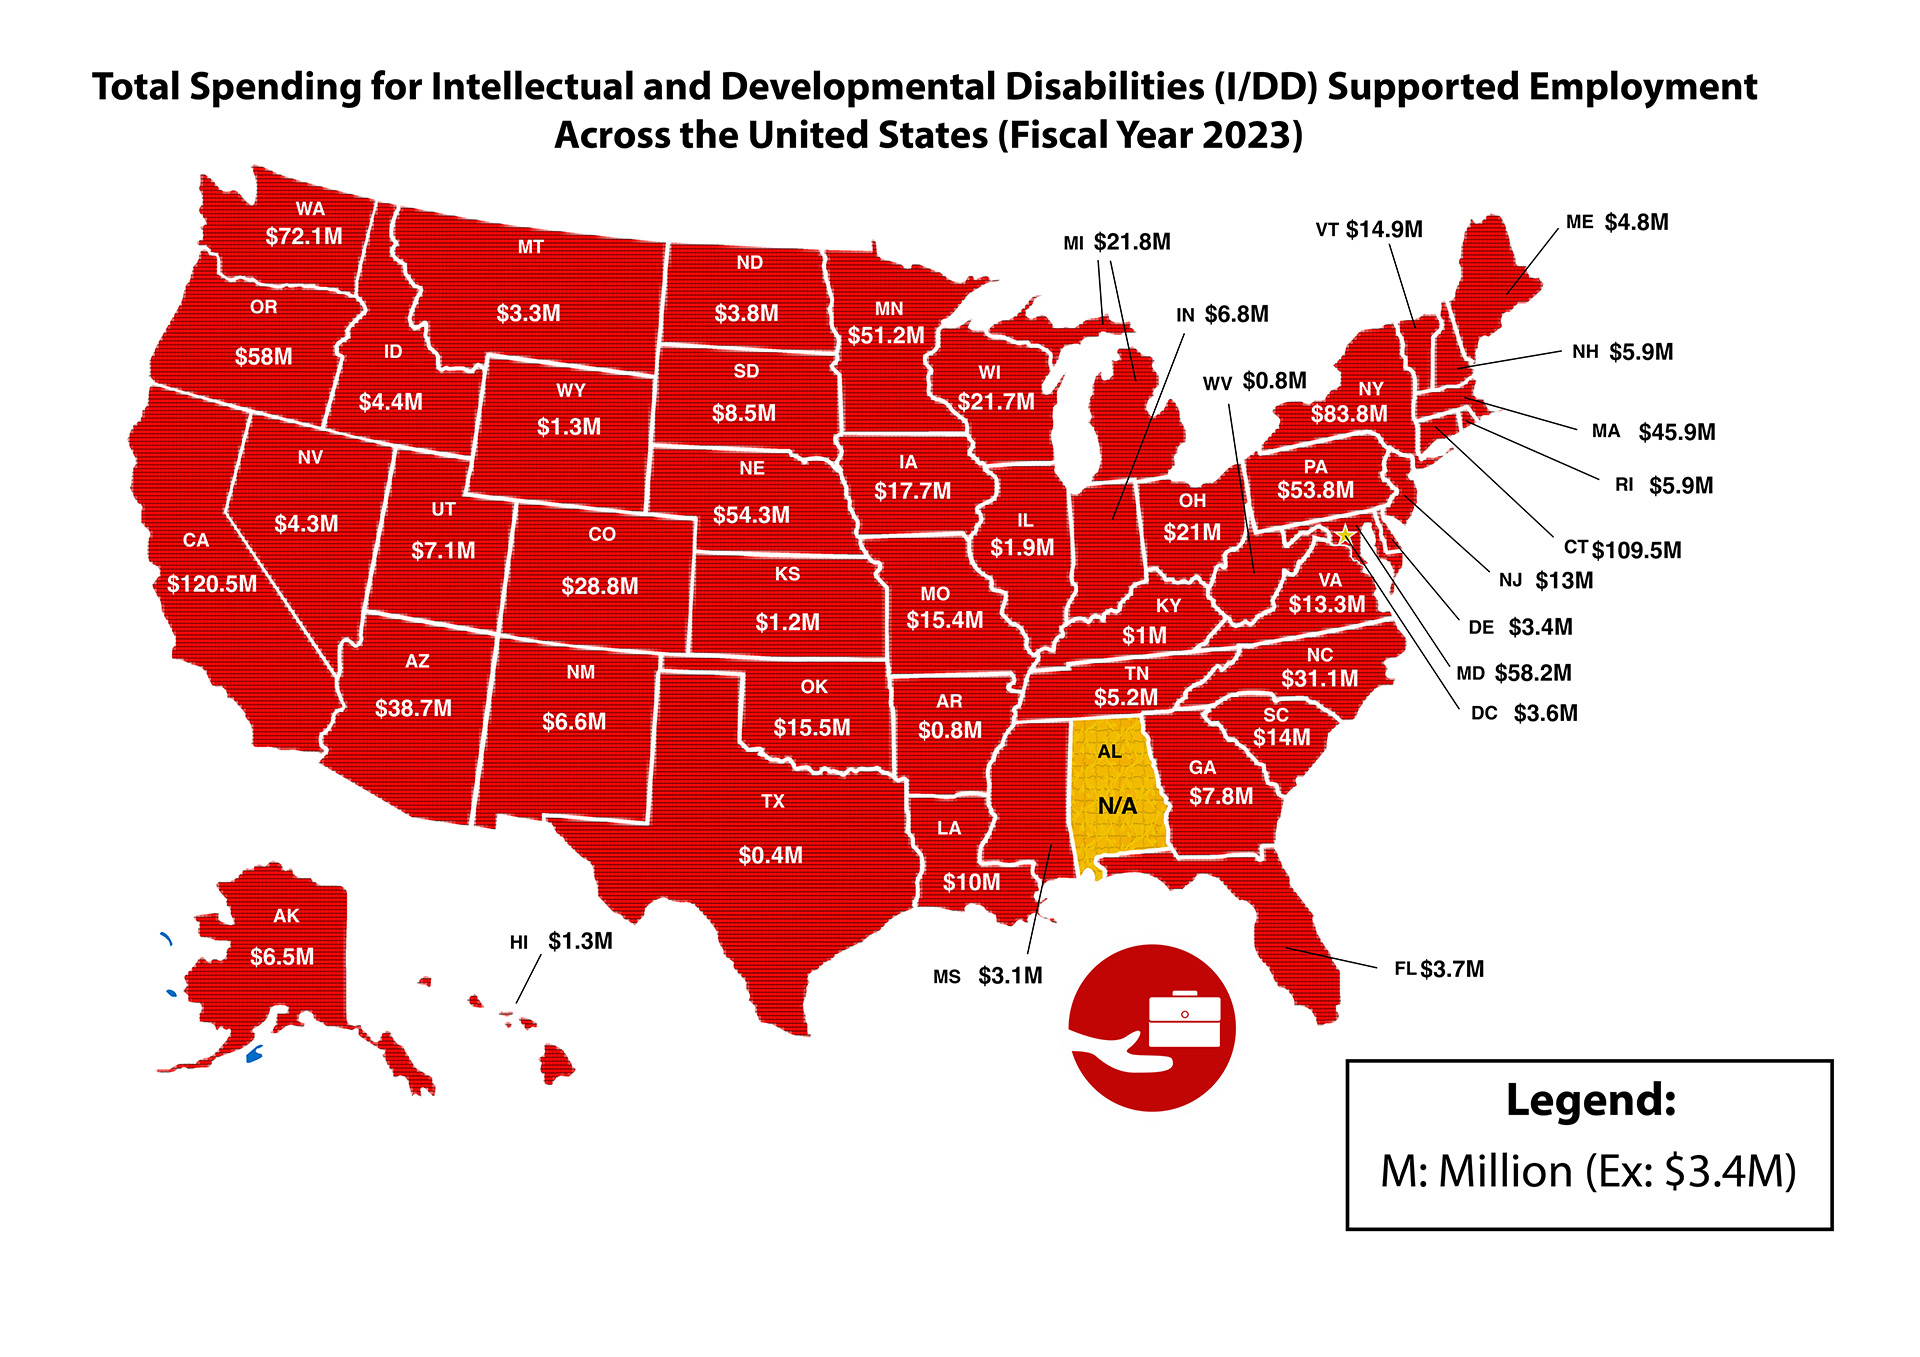
Total Spending for Intellectual and Developmental Disabilities (I/DD) Supported Employment Across the United States (Fiscal Year 2023)
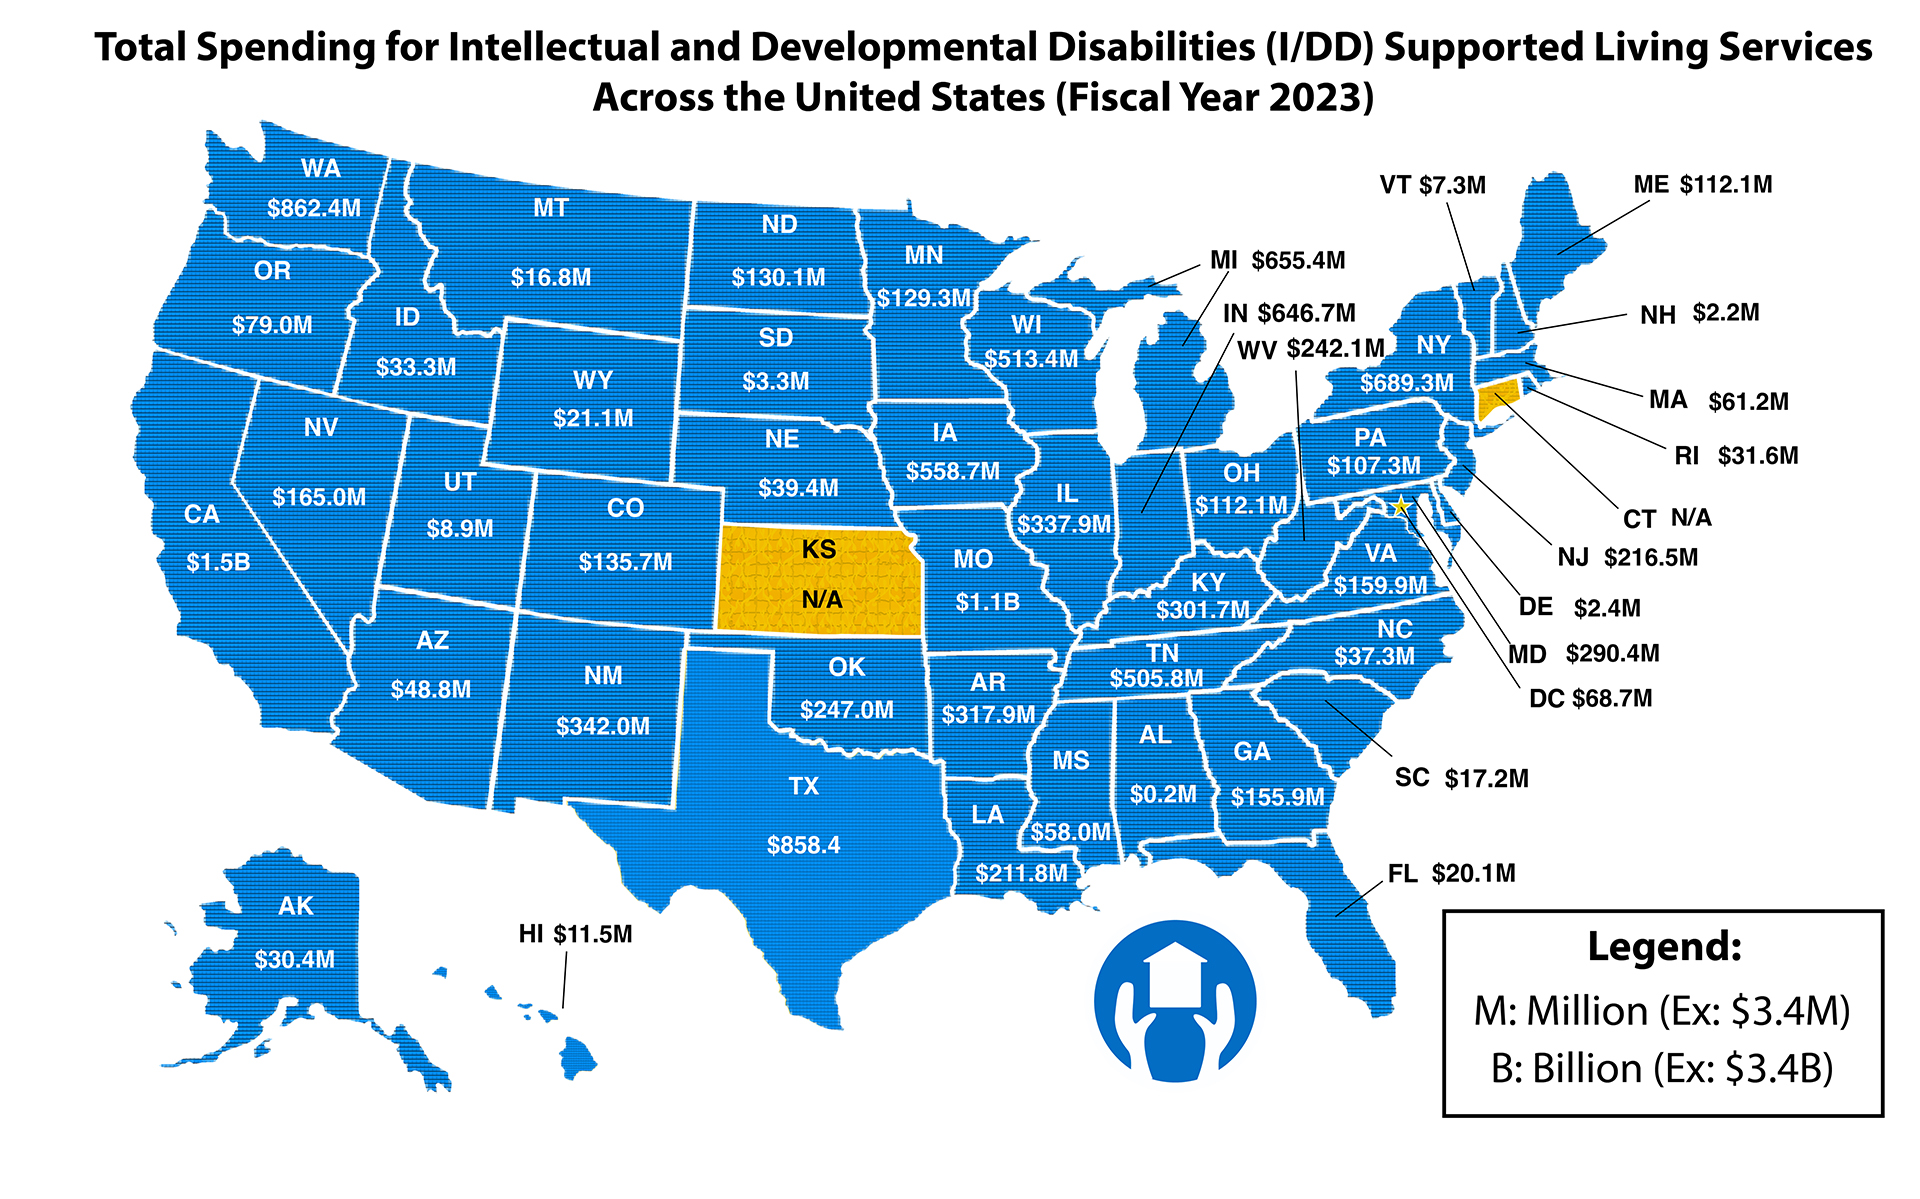
Total Spending for Intellectual and Developmental Disabilities (I/DD) Supported Living Services Across the United States (Fiscal Year 2023)
Total Spending for Intellectual and Developmental Disabilities (I/DD) Family Support Across the United States (Fiscal Year 2023)
State of the States Information
For more information about State of the States, contact stateofthestates@ku.edu
This project is funded through a cooperative agreement from the Administration on Community Living, U.S. Department of Health and Human Services, Cooperative Agreement #90DNPAPA0005. Grantees undertaking projects under government sponsorship are encouraged to express freely their findings and conclusions. Points of view or opinions do not therefore necessarily represent official ACL policy.
Suggested Citation
State of the States in Intellectual and Developmental Disabilities (year). [Page Name]. Lawrence: University of Kansas, State of the States, Kansas Center on Developmental Disabilities, Life Span Institute. Retrieved from: https://stateofthestates.ku.edu