Chart Creator
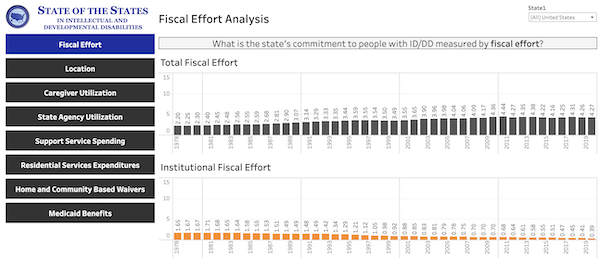 State of the States Chart Creator has interactive longitudinal data visualizations on a variety of topics including Fiscal Effort, Location, Caregiver Utilization, State Agency Utilization, and more. You can filter by states and territories and view data collected over a period of time.
Please fill out the form below and to interact and explore visual data!