How Does Spending on Intellectual and Developmental Disabilities (I/DD) Services and Supports Vary Across States?
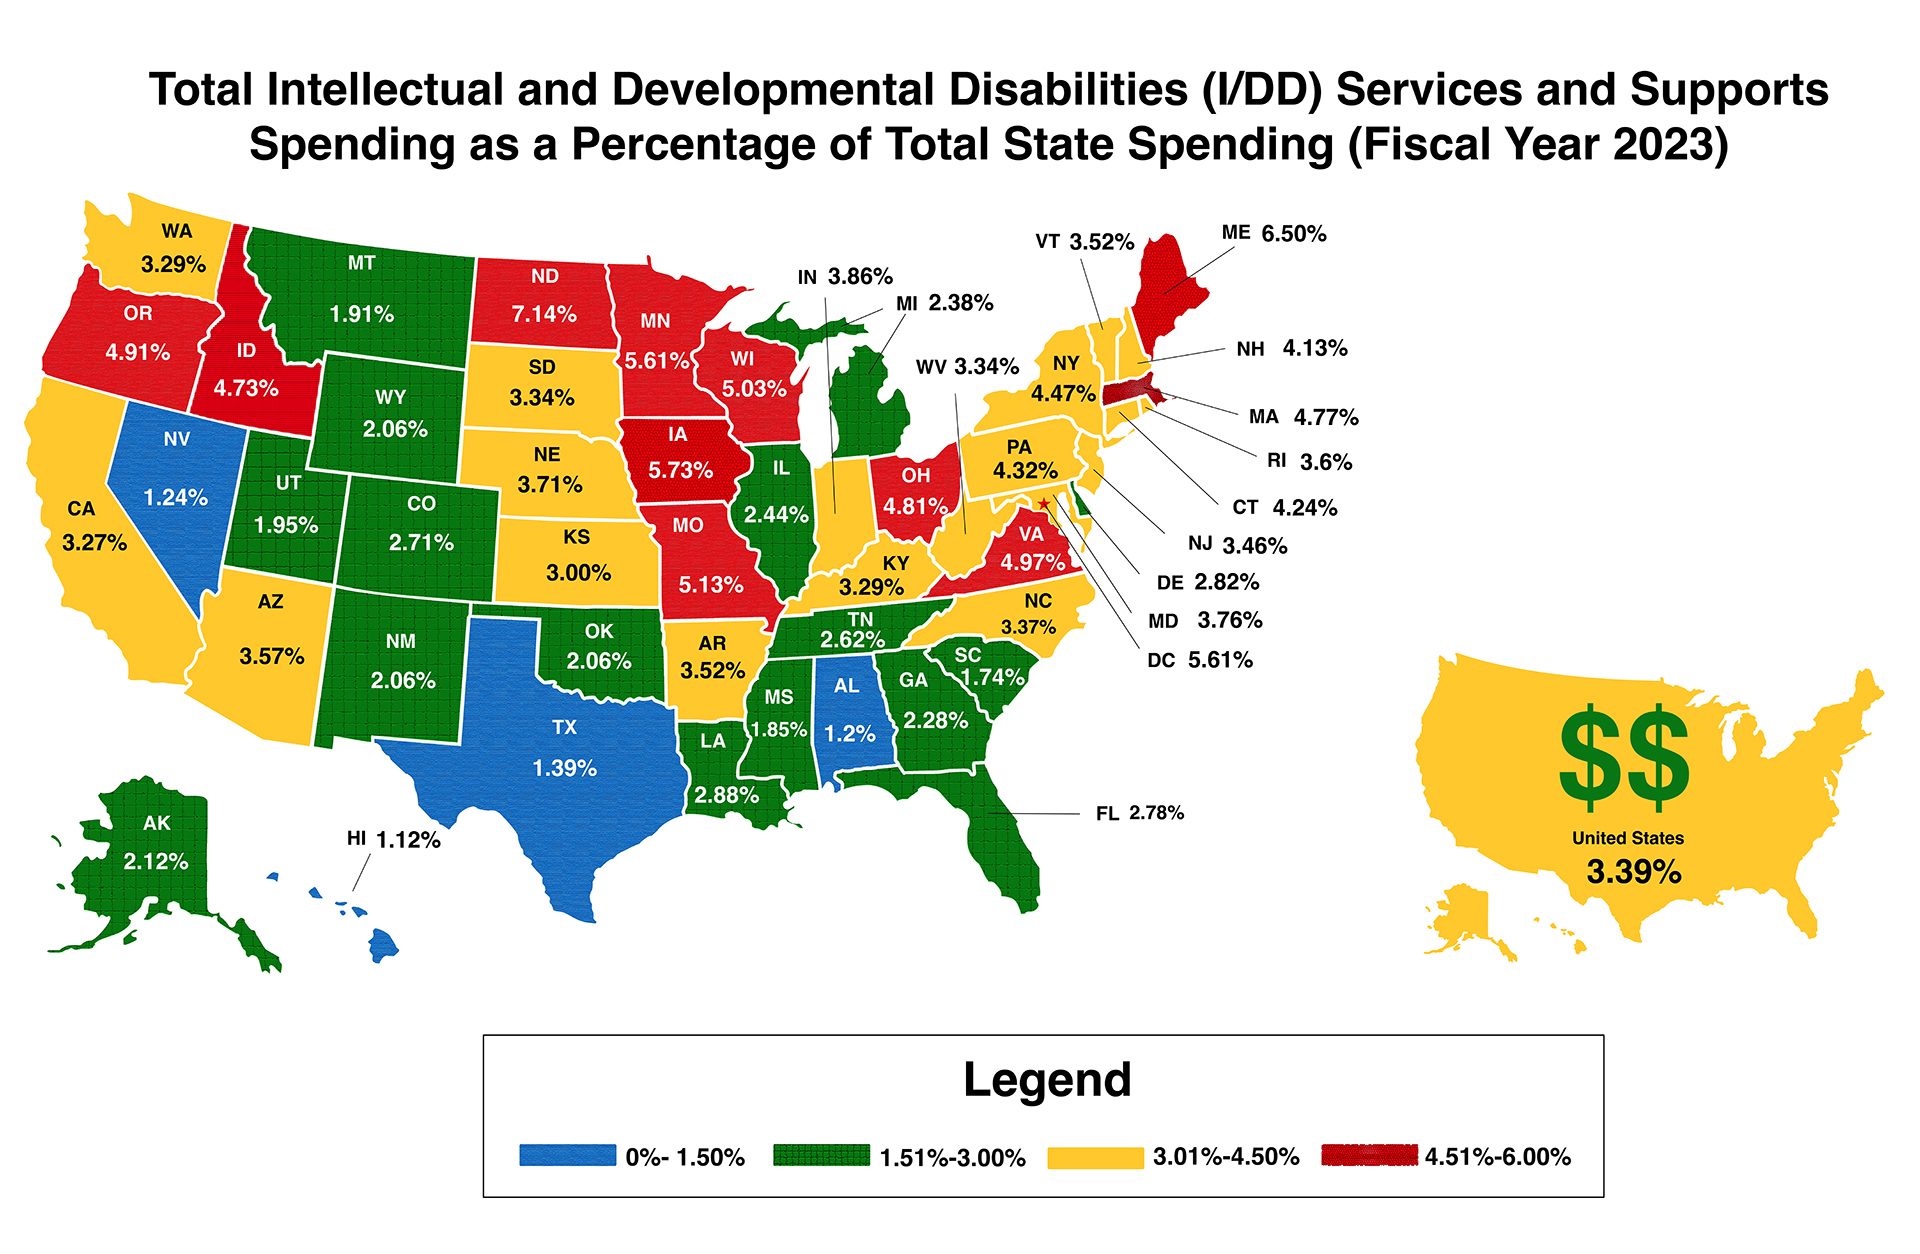

Total Intellectual and Developmental Disabilities (I/DD) Services and Supports Spending as a Percentage of Total State Spending
(Fiscal Year 2021)

A colored map of the United States illustrating Total IDD Spending for Services as a percentage of Total State Spending. States ranging from 0% to 1.5% are blue, states ranging from 1.51% to 3% are are green, states ranging from 3.01% to 4.5% are yellow, and states ranging from 4.51% to 6% are red.


I/DD Spending as Percentage of Total State Spending
StateI/DD Spending as Percentage of Total State Spending
AK2.23
AL1
AR3
AZ2.98
CA2.24
CO1.76
CT2.14
DC3.47
DE1.87
FL2.2
GA1.85
HI0.75
IA4.78
ID3.52
IL2
IN2.61
KS2.27
KY2.75
LA2.27
MA3.66
MD2.18
ME5.25
MI2.12
MN4.17
MO3.66
MS1.58
MT1.64
NC1.81
ND3.75
NE2.95
NH3.14
NJ2.99
NM1.96
NV1.14
NY4.32
OH4.08
OK2.12
OR3.48
PA3.41
RI2.12
SC1.8
SD3.04
TN2.42
TX1.15
US2.57
UT1.4
VA0.68
VT3.1
WA2.5
WI3.92
WV3.52
WY2.19


State of the States Information

For more information about State of the States, contact stateofthestates@ku.edu

This project is funded through a cooperative agreement from the Administration on Community Living, U.S. Department of Health and Human Services, Cooperative Agreement #90DNPAPA0005. Grantees undertaking projects under government sponsorship are encouraged to express freely their findings and conclusions. Points of view or opinions do not therefore necessarily represent official ACL policy.

Suggested Citation

State of the States in Intellectual and Developmental Disabilities (year). [Page Name]. Lawrence: University of Kansas, State of the States, Kansas Center on Developmental Disabilities, Life Span Institute. Retrieved from: https://stateofthestates.ku.edu